

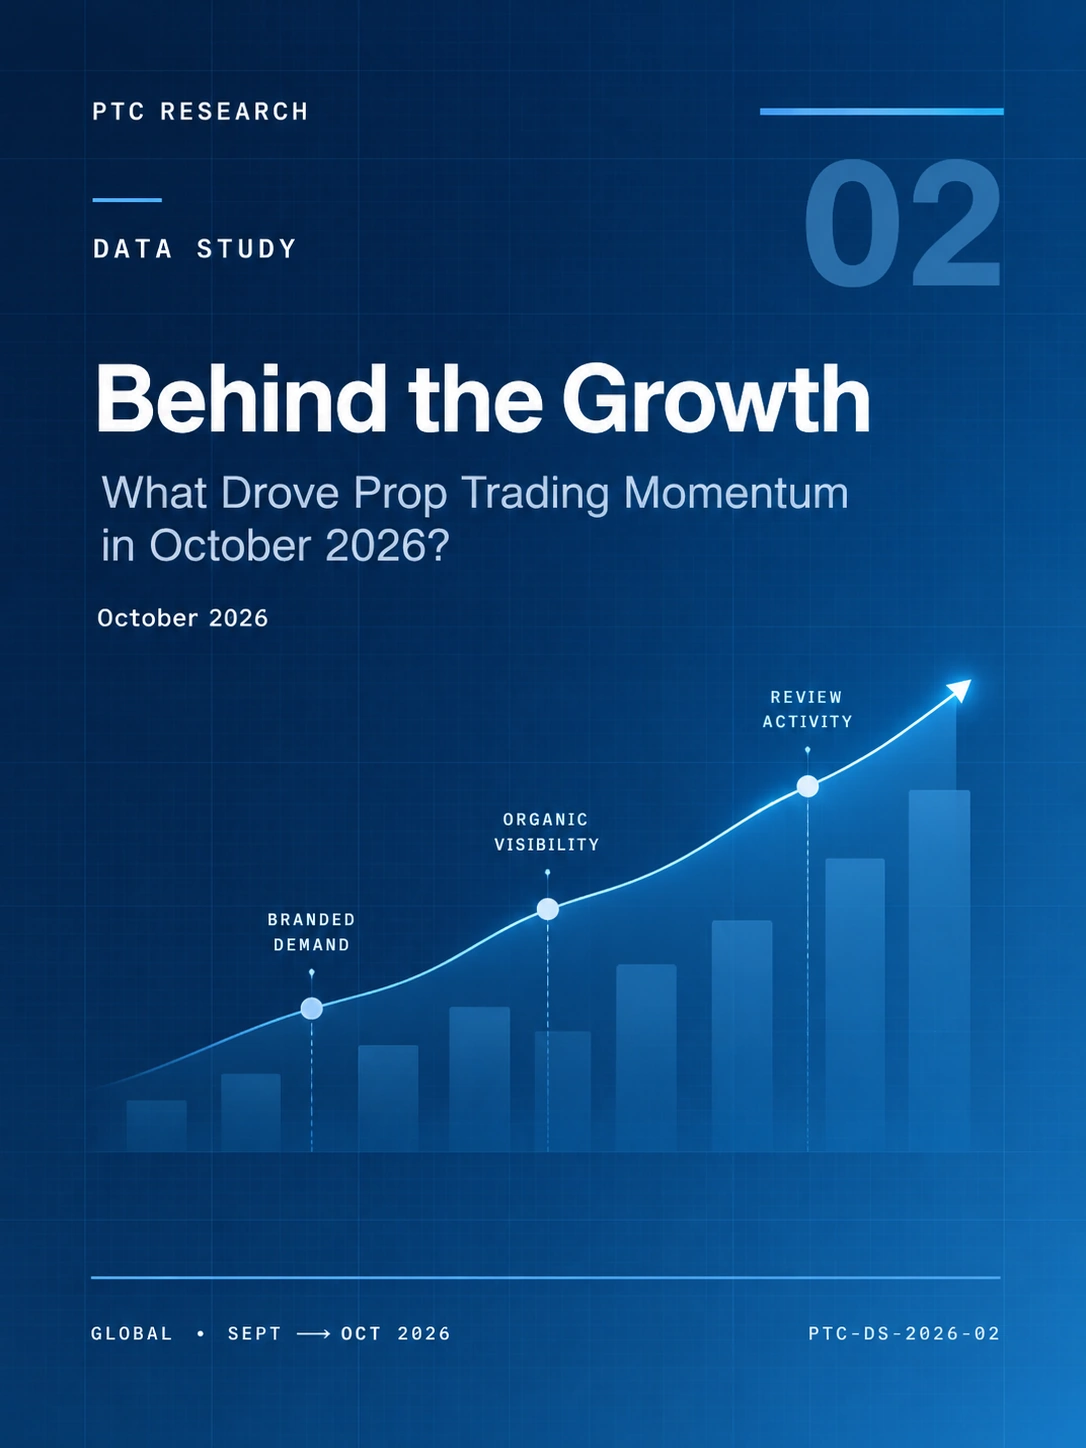
Behind the Growth
What drove prop trading momentum in October? PTC examines 15 Growth Index leaders, five firm cases and the evidence behind their public-market signals.
Read the data study →
Independent rankings, modelled industry estimates, detailed firm dossiers and evidence-based research on the global retail prop trading industry.
Loading published firm intelligence…
Browse all firm dossiers →What drove prop trading momentum in October? PTC examines 15 Growth Index leaders, five firm cases and the evidence behind their public-market signals.
Read the data study →
PTC maps founders, legal entities, holding structures and corporate groups behind major retail prop trading brands, separating verified ownership from partnerships, infrastructure and service relationships.

PTC analyzes the July-to-August ranking transition across PTC Power, Market Presence and the comparable Growth cohort, separating explained movement from coverage effects.
Rankings & research · Unsubscribe anytime
Share of global trader interest by country.
Index score, normalised by population.
Share of firms using each platform.
Payout amount with geography attributed.
Current industry structure, scale, adoption and research indicators in one workspace.
Payout research, evidence coverage and publication status, with independent monitoring results released only after approval.
Documented adverse developments, evidence states and recent firm-level risk signals.
Track material changes to drawdown, consistency, news, holding and program rules.
Recorded regulatory actions, warnings and jurisdiction developments affecting prop firms.
Newly established prop firms, launch dates, platforms, pricing and current status.
PTC distinguishes between observed data, PTC estimates, derived metrics and research findings, with methodology and coverage disclosed across its intelligence products.